728x90
반응형
지역 및 소득 수준별 인구 10만명당 ATM 분포 : Distribution of ATMs per 100,000 Adults by Region and Income Level
Data source: World Bank - ATMs (per 100,000 adults)* Kept the latest year data for countries with available data, and considered it as 0 for countries without data
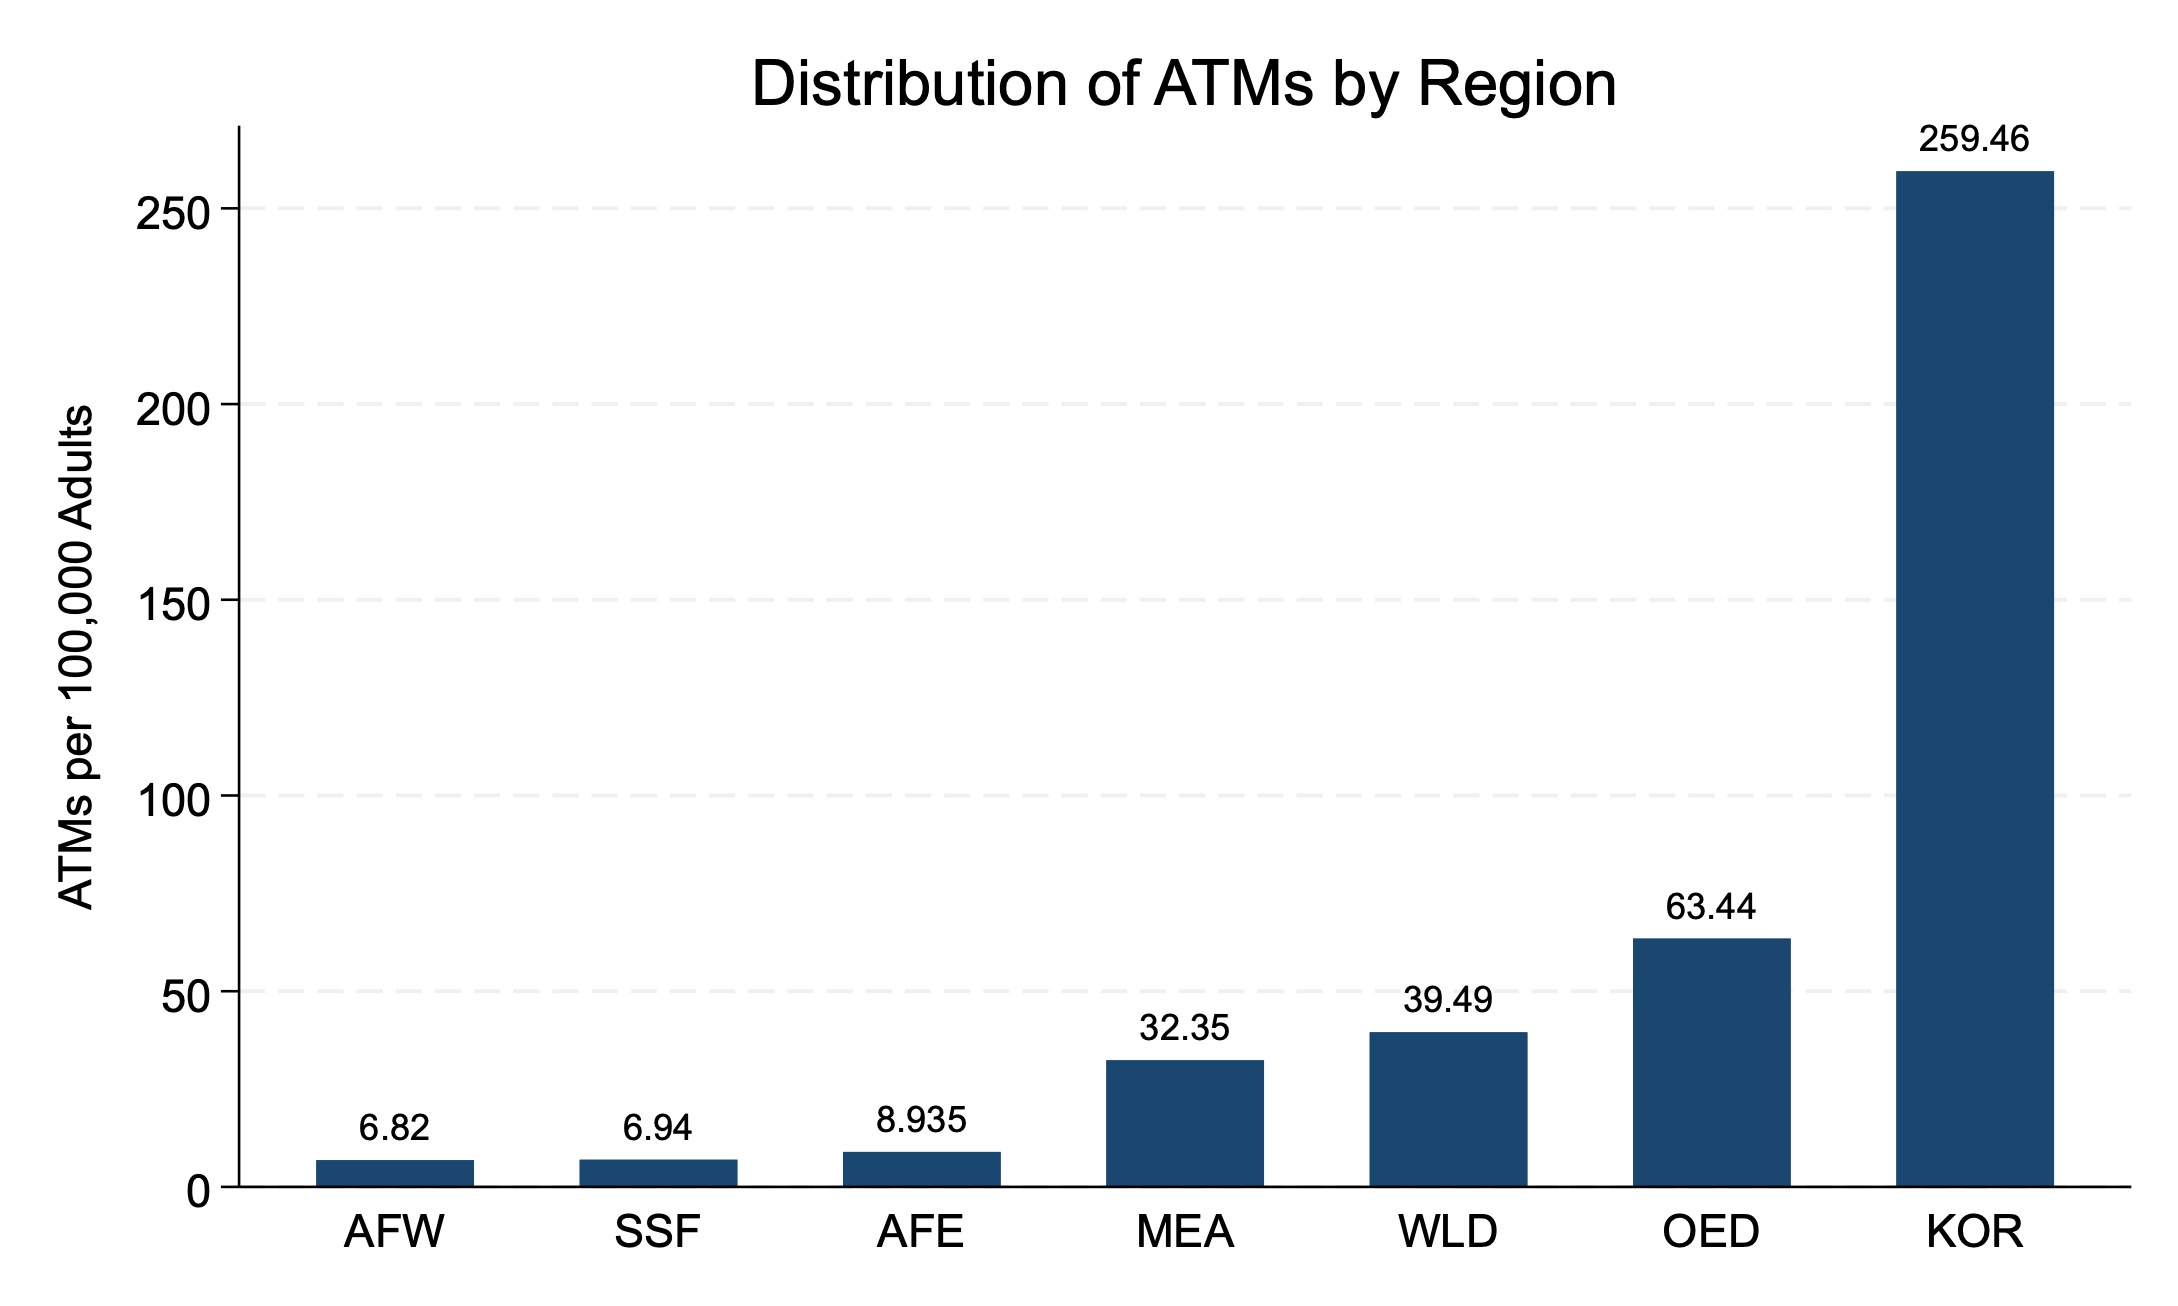
1. Distribution of ATMs per 100,000 Adults by Region
| region | iso | year | ATMs (per 100,000 adults) |
| World | WLD | 2021 | 39.49 |
| Latin America & Caribbean | LCN | 2021 | 43.26 |
| East Asia & Pacific | EAS | 2021 | 49.63 |
| Europe & Central Asia | ECS | 2021 | 59.12 |
| European Union | EUU | 2021 | 62.72 |
| OECD members | OED | 2021 | 63.44 |
| North America | NAC | 2021 | 212.44 |
| Korea, Rep. | KOR | 2020 | 259.46 |
| Fragile and conflict affected situations | FCS | 2021 | 7.89 |
| South Asia | SAS | 2021 | 15.86 |
| Small states | SST | 2021 | 39.49 |
| Africa Eastern and Southern | AFE | 2021 | 8.94 |
| Africa Western and Central | AFW | 2021 | 6.82 |
| Middle East & North Africa | MEA | 2021 | 32.35 |
| Sub-Saharan Africa | SSF | 2021 | 6.94 |
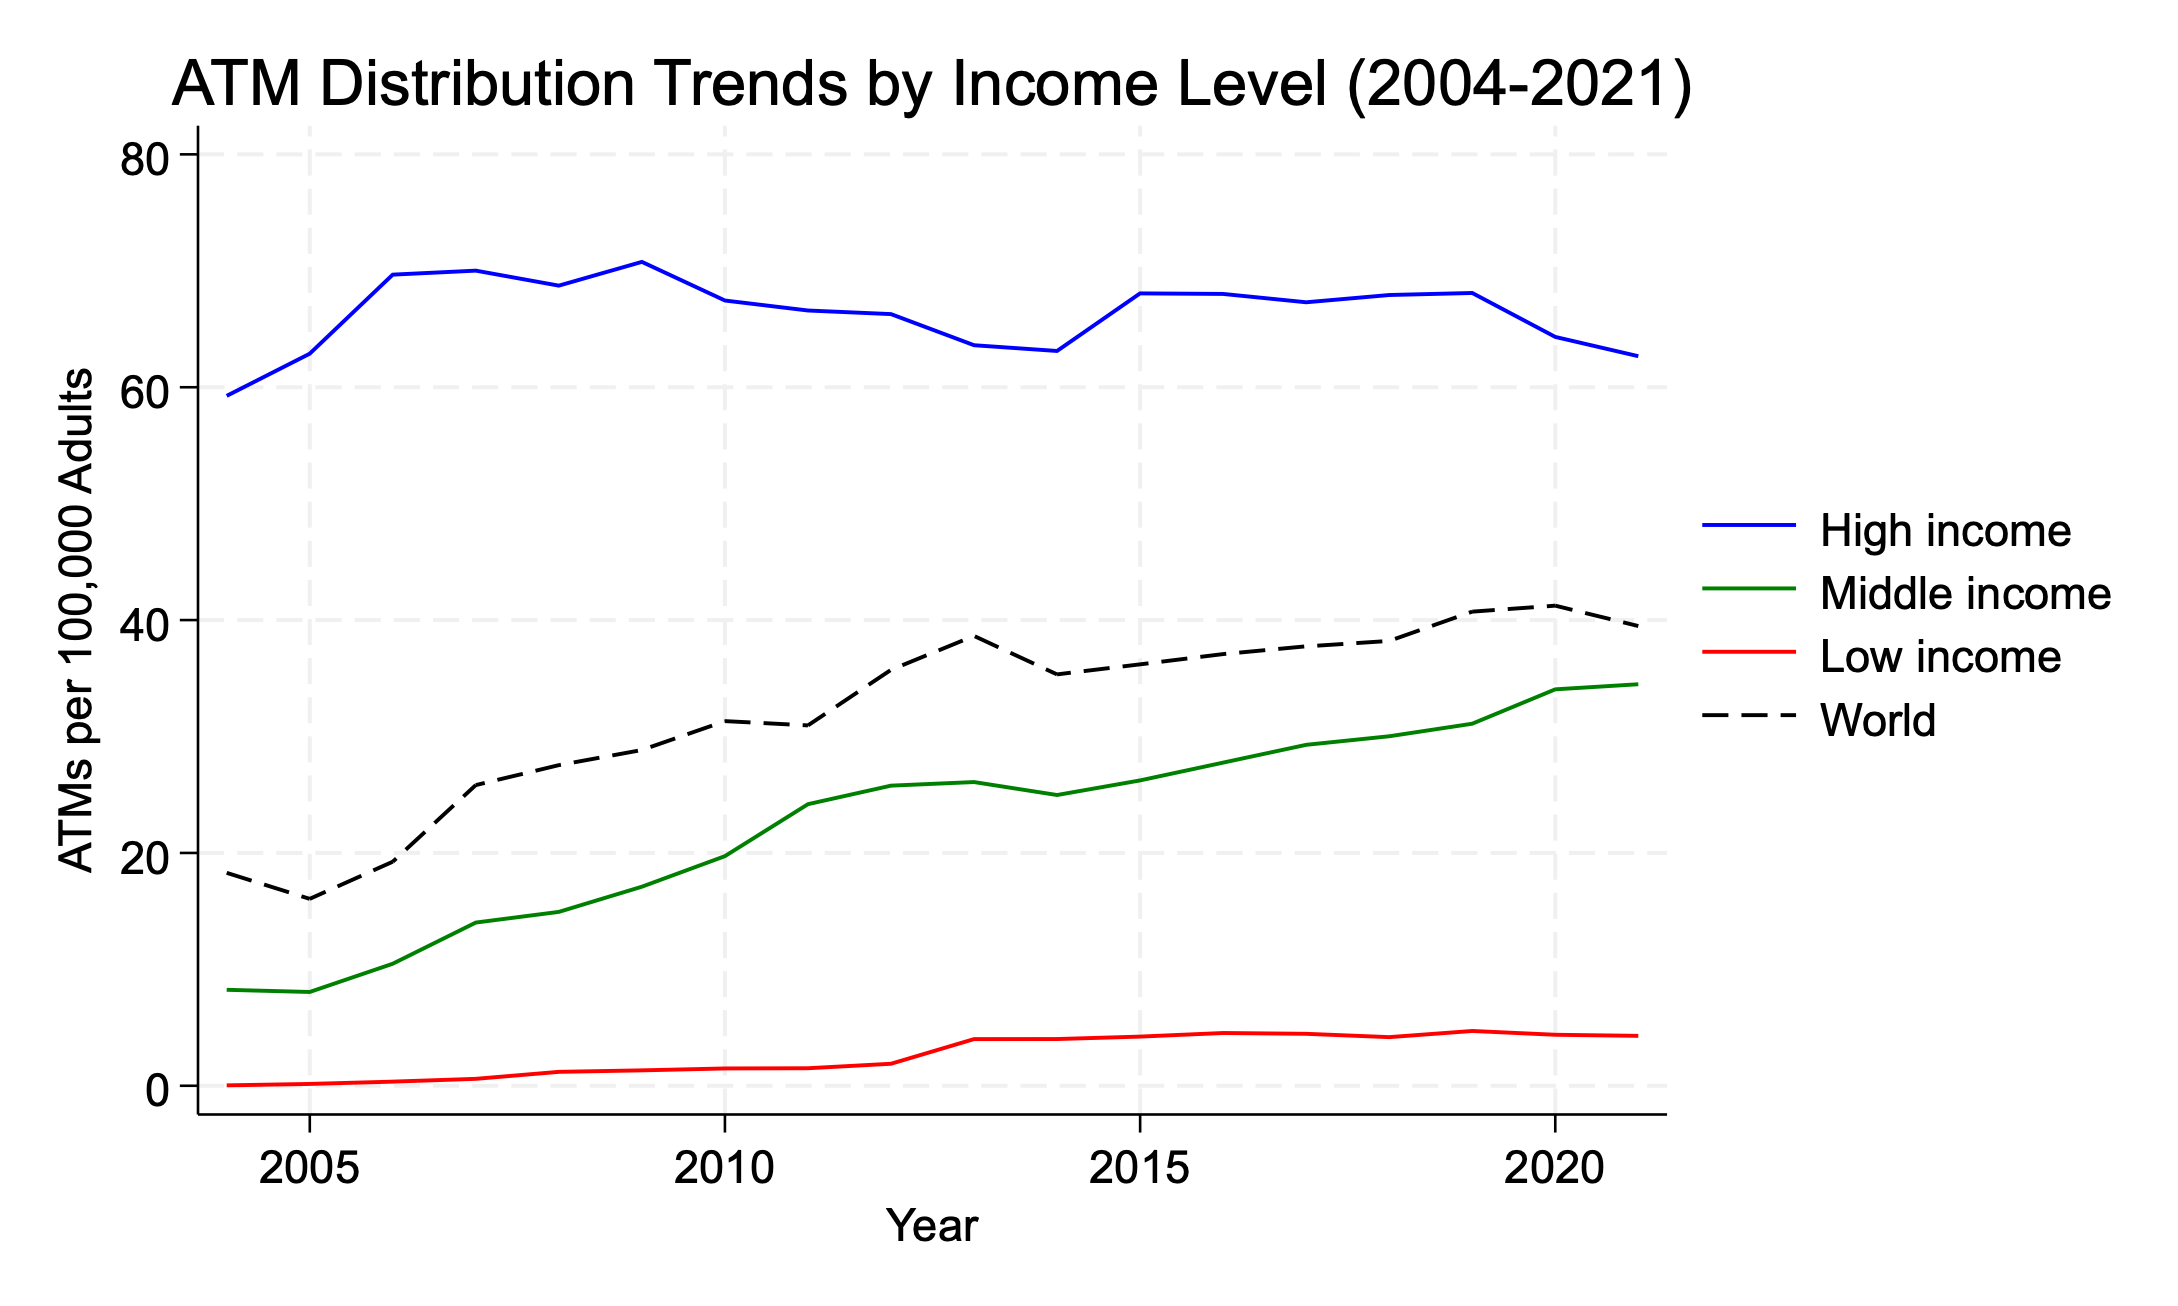
2. Distribution of ATMs per 100,000 Adults by income Level in 2021
| region | iso | year | ATMs (per 100,000 adults) |
| High income | HIC | 2021 | 62.67 |
| Middle income | MIC | 2021 | 34.49 |
| Upper middle income | UMC | 2021 | 53.39 |
| Lower middle income | LMC | 2021 | 20.26 |
| Middle income | MIC | 2021 | 34.49 |
| Low & middle income | LMY | 2021 | 28.32 |
| Low income | LIC | 2021 | 4.30 |
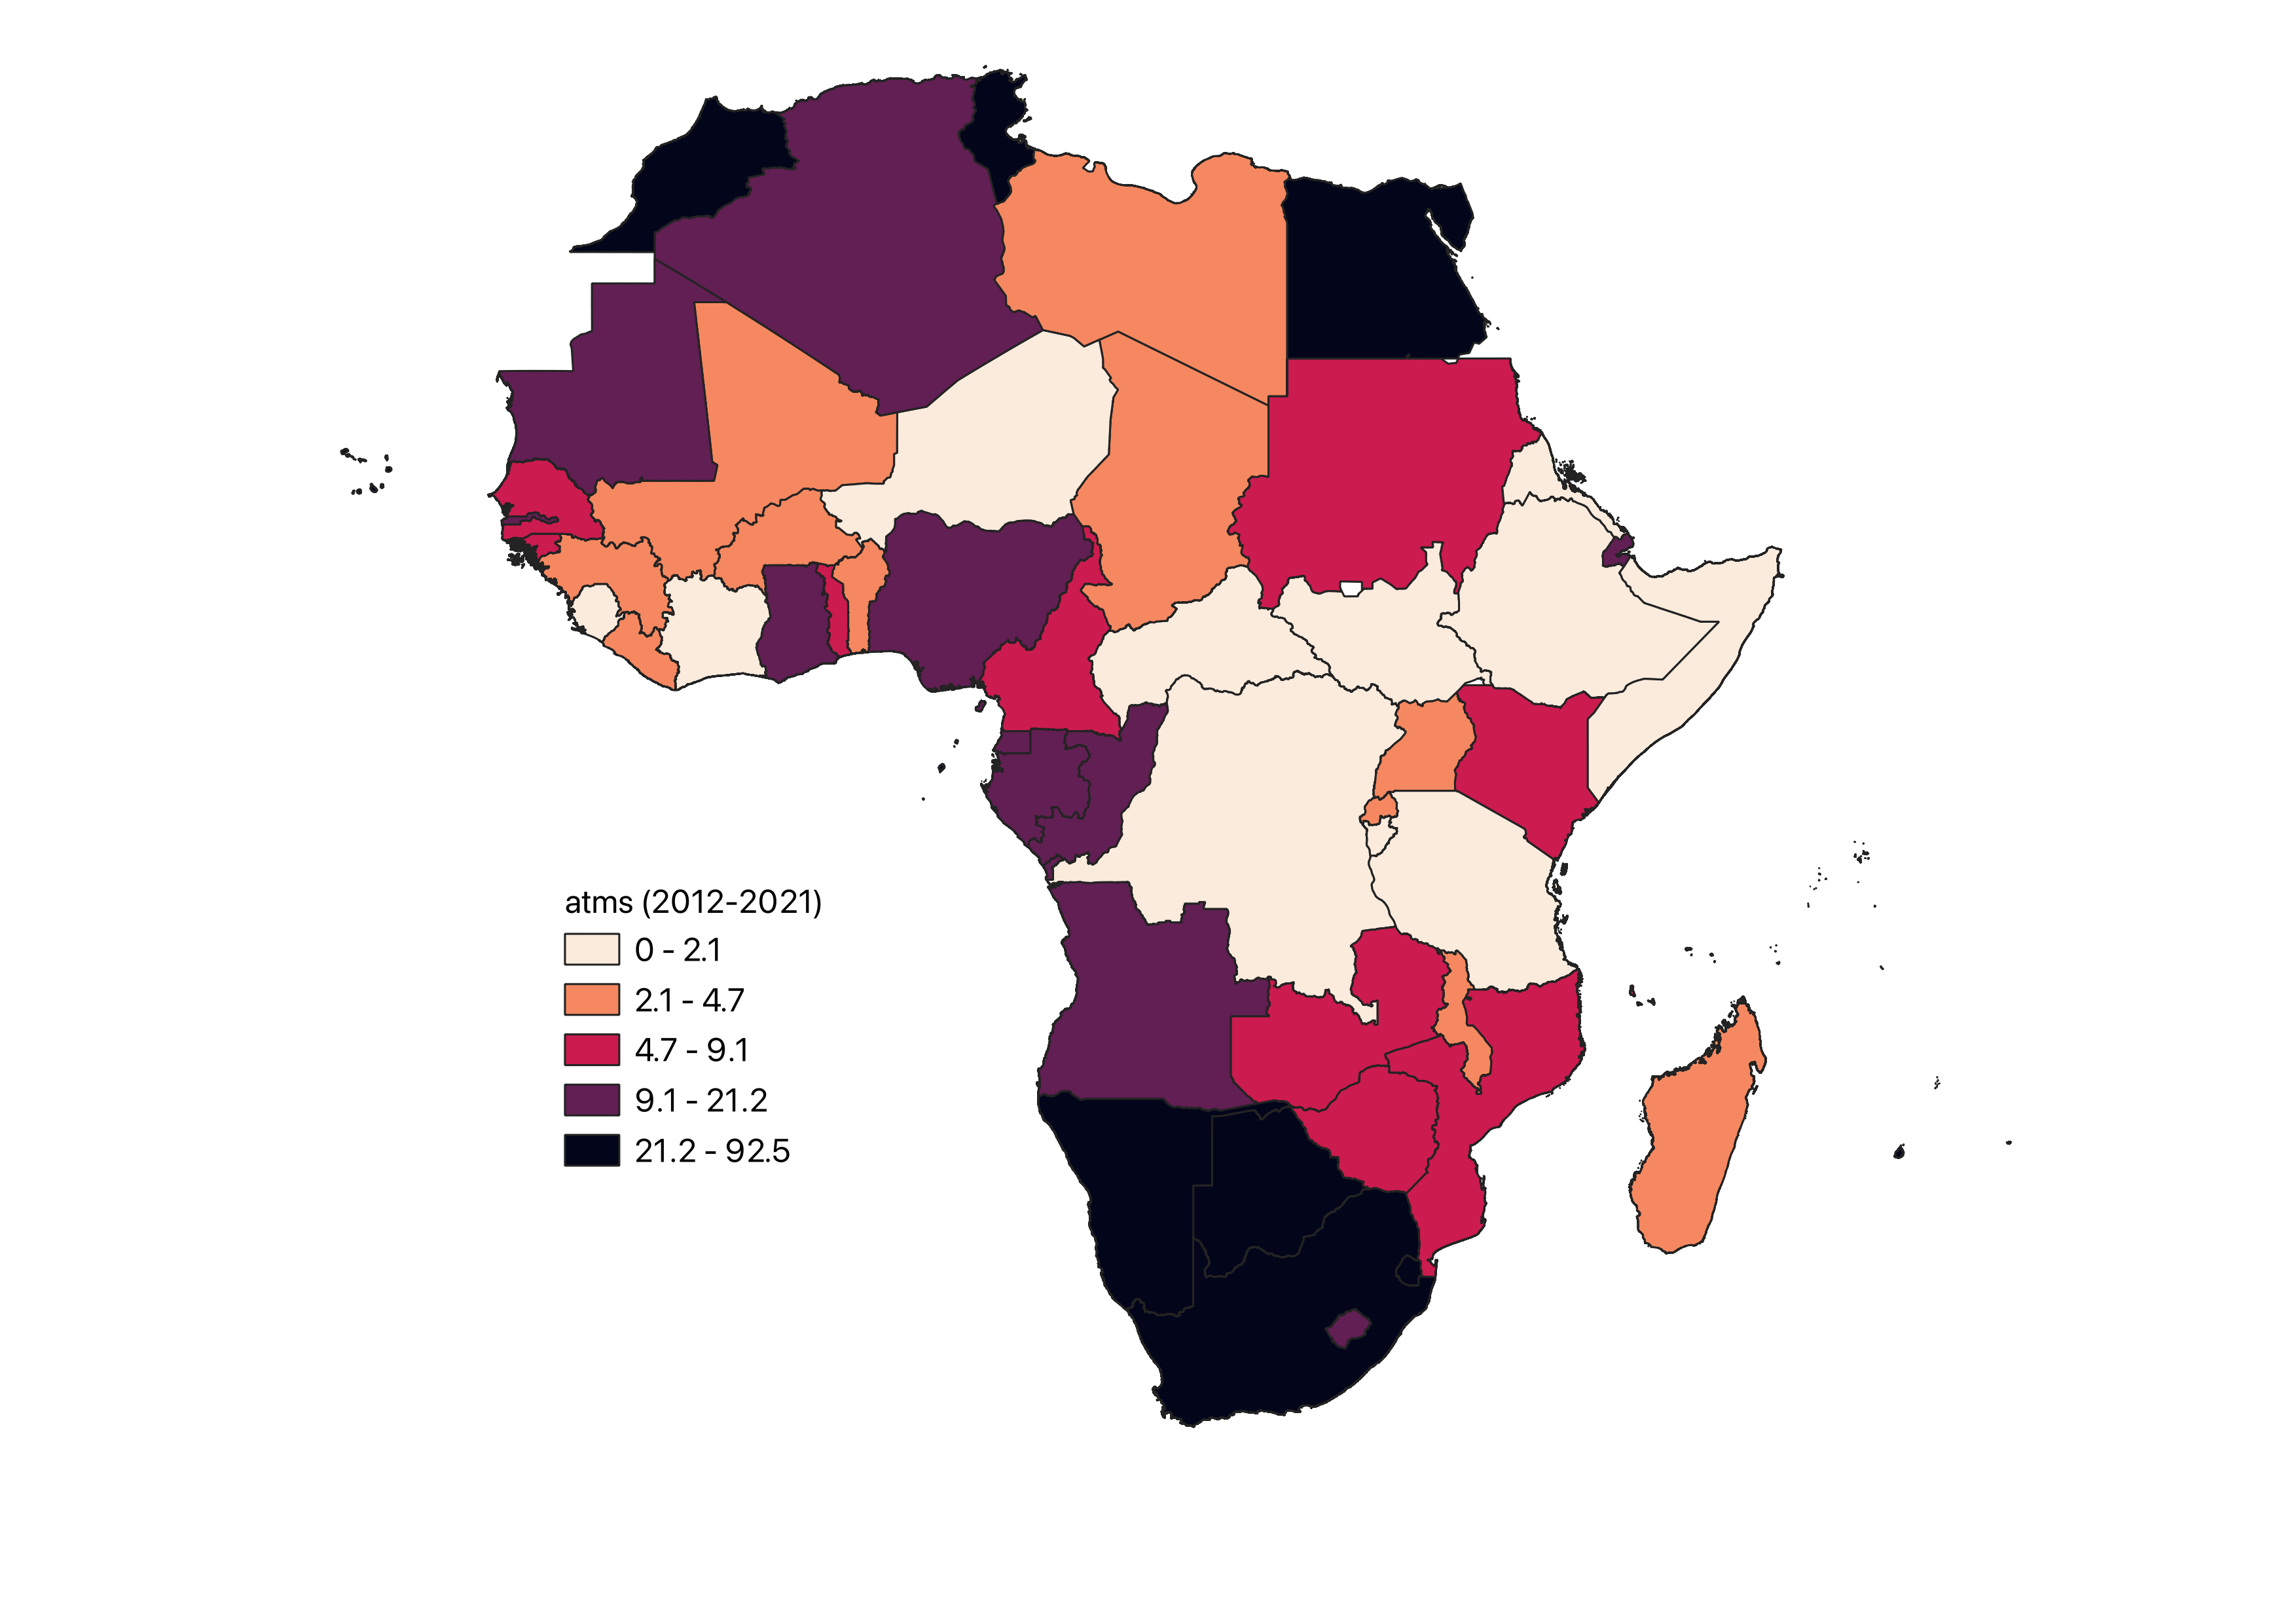
3. Distribution of ATMs per 100,000 Adults In Africa
728x90
반응형
'▪ Analytics' 카테고리의 다른 글
| School-Age Population in Korean Districts (2000-2023) (0) | 2024.08.18 |
|---|---|
| Population Trends in Korean Districts (2015-2040) (0) | 2024.08.11 |
| Financial indicators for assessing African financial inclusion (0) | 2024.08.06 |
| Mid-Year Resident Population of Korean Women (20-30 years) (0) | 2024.08.06 |
| Census Population of Korean Women of Reproductive Age (20-39 years) (0) | 2024.08.06 |


