World Bank Group - Infrastructure Chief Economist Office
March 2023
The Impact of Infrastructure on Development Outcomes - A Meta-Analysis
This paper presents a meta-analysis of the infrastructure research done over more than three decades, using a data- base of over a thousand estimates from 221 papers reporting outcome elasticities. The analysis casts a wide net to include the transport, energy, and digital or information and communication technology (ICT) sectors, and the whole set of outcomes covered in the literature, including output, employment and wages, inequality and poverty, trade, education and health, population, and environmental aspects. The results allow for an update of the underlying parameters of interest, the “true” underlying infrastructure elasticities, accounting for publication bias, as well as for heterogeneity stemming from both study design and context, with a particular focus on developing countries.
1. Introduction
- Lack of access to these critical infrastructures in turn often means that people are being curtailed from opportunities to learn, receive good quality healthcare, access good job openings, or develop a business. While the facts may lead to the simple conclusion that more investment in infrastructure is needed, they also raise complex questions. "What is the most efficient way to extend access in each sector?"
- At the root of these issues lies a fundamental question: given the limited resources available, do investments in some sectors have higher social and economic returns than in others? And, are these trade-offs different depending on the context, the initial level of development for example?
- To start providing answers to this question, this paper performs a meta-analysis of the infrastructure research done over the last three decades regarding the transport, energy, and digital or information and communication technology (ICT) sectors, casting a wide net to include the whole set of outcomes covered in the literature: output micro and macro, labor market inequality and poverty, trade, human capital, population, environment, and land Value.
- The first generation of research was most analyzing growth and productivity effects, based on a production function framework and using public capital data in a panel cross-section framework. More recently, with the increasing availability of more granular information, including geospatial data, and the computing power to process very large databases, the focus has shifted to studies analyzing a wide array of outcomes, specific sectors, and implementing robust micro-econometric identification strategies.
- We built a database of over a thousand estimates from 221 papers reporting infrastructure elasticities or semi-elasticities that can readily be converted into comparable elasticities. The papers included are the result of a systematic search through literature reviews and publication databases and were produced between 1983 and 2023.
- This study contributes to the literature on infrastructure by providing a systematic assessment of the body of research reporting elasticities of infrastructure for a large set of outcomes and across three sectors. In that sense, it aims to providing updated reference points regarding the quantitative effect of infrastructure, useful for both researchers and practitioners engaged in infrastructure projects.
| Five main conclusions | |
| 1 | The literature on infrastructure has diversified hugely since the 1980s. From an almost exclusive initial focus on the output-elasticity and the use of public capital data, it has extended to specific sectors, many different outcomes, and a large variety of data sources and types. This has led to increasing heterogeneity in the literature, and has implications for the way we conduct this meta-analysis, leading us to focus mostly on specific sub-samples. |
| 2 | As is generally the case for many other economic topics, it is subject to significant publication bias in favor of positive and significant results. |
| 3 | As the literature recognized the limitations and moved away from its initial focus on public capital, the estimates it has produced have become relatively smaller. We report average estimated elasticities that range between zero and 0.06 for most of the sector-outcome categories we consider. We are however careful in interpreting these magnitudes. As we discuss in the concluding section, given the differences in the nature of infrastructure indicators used, it is unclear whether lower elasticities necessarily entail smaller marginal product of capital. |
| 4 | We look at the average elasticities specifically for developing countries samples, finding that they are generally larger than those for developed economies for the digital and transport sector, but not for energy. A few large estimates are found in very specific sector-outcome categories, such as digital-micro-output, and transport-labor. |
| 5 | We discuss how these estimates could be leveraged to produce marginal rates of return for specific sector-outcomes, highlighting the lack of relevant data in this area, which appears to be the next priority in terms of research. |
2. Data
2.1 Studies included in the review: search and selection criteria
This meta-analysis analyzes the impact of infrastructure on a large array of economic and social outcomes.
Infrastructure is understood here as covering three main sectors:
- Transport, comprising roads, railroads, ports and airports
- Energy, covering production, transmission, and distribution of electricity to households and firms (referred to access from a demand point of view)
- Digital, also often referred to as information and communication technology, or ICT, and including fixed and mobile phones, Internet access and use, backbone Internet development
Study design characteristics include
- the aggregation level (country-, region, district, or unit specific-level data; firm or household data) and
- type of data used (monetary measures of infrastructure such as public capital vs. physical measures),
- the theoretical framework used as a reference,
- whether the data has a spatial dimension, and
- the type of econometric technique used, with a specific focus on whether endogeneity is explicitly addressed and how
Variables in the Dataset

2.2 Descriptive statistics
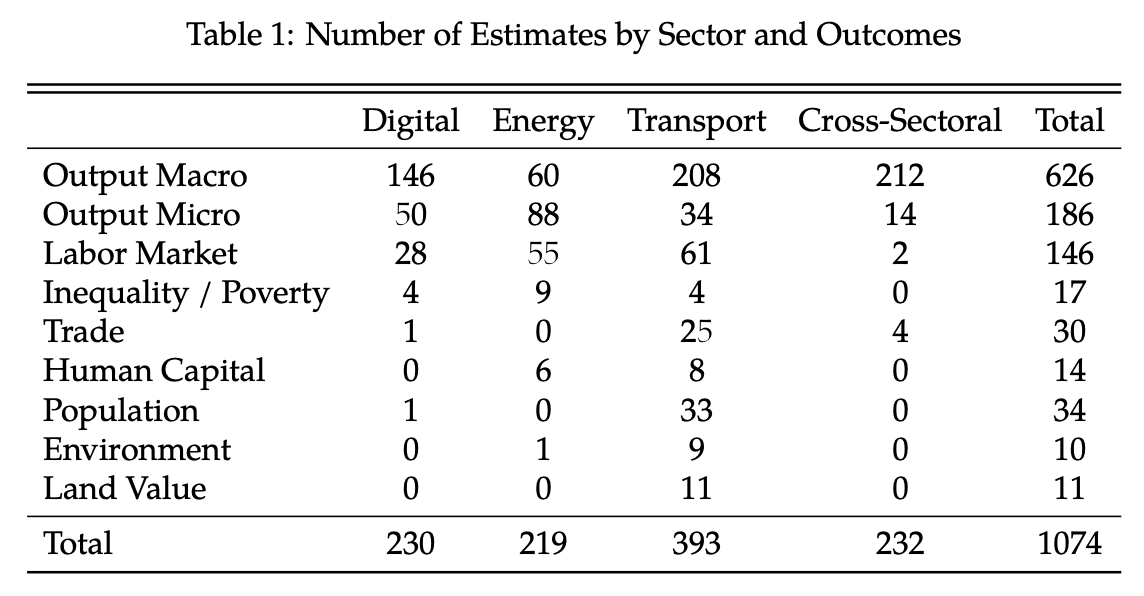
The final database includes 221 papers and 1074 estimates.

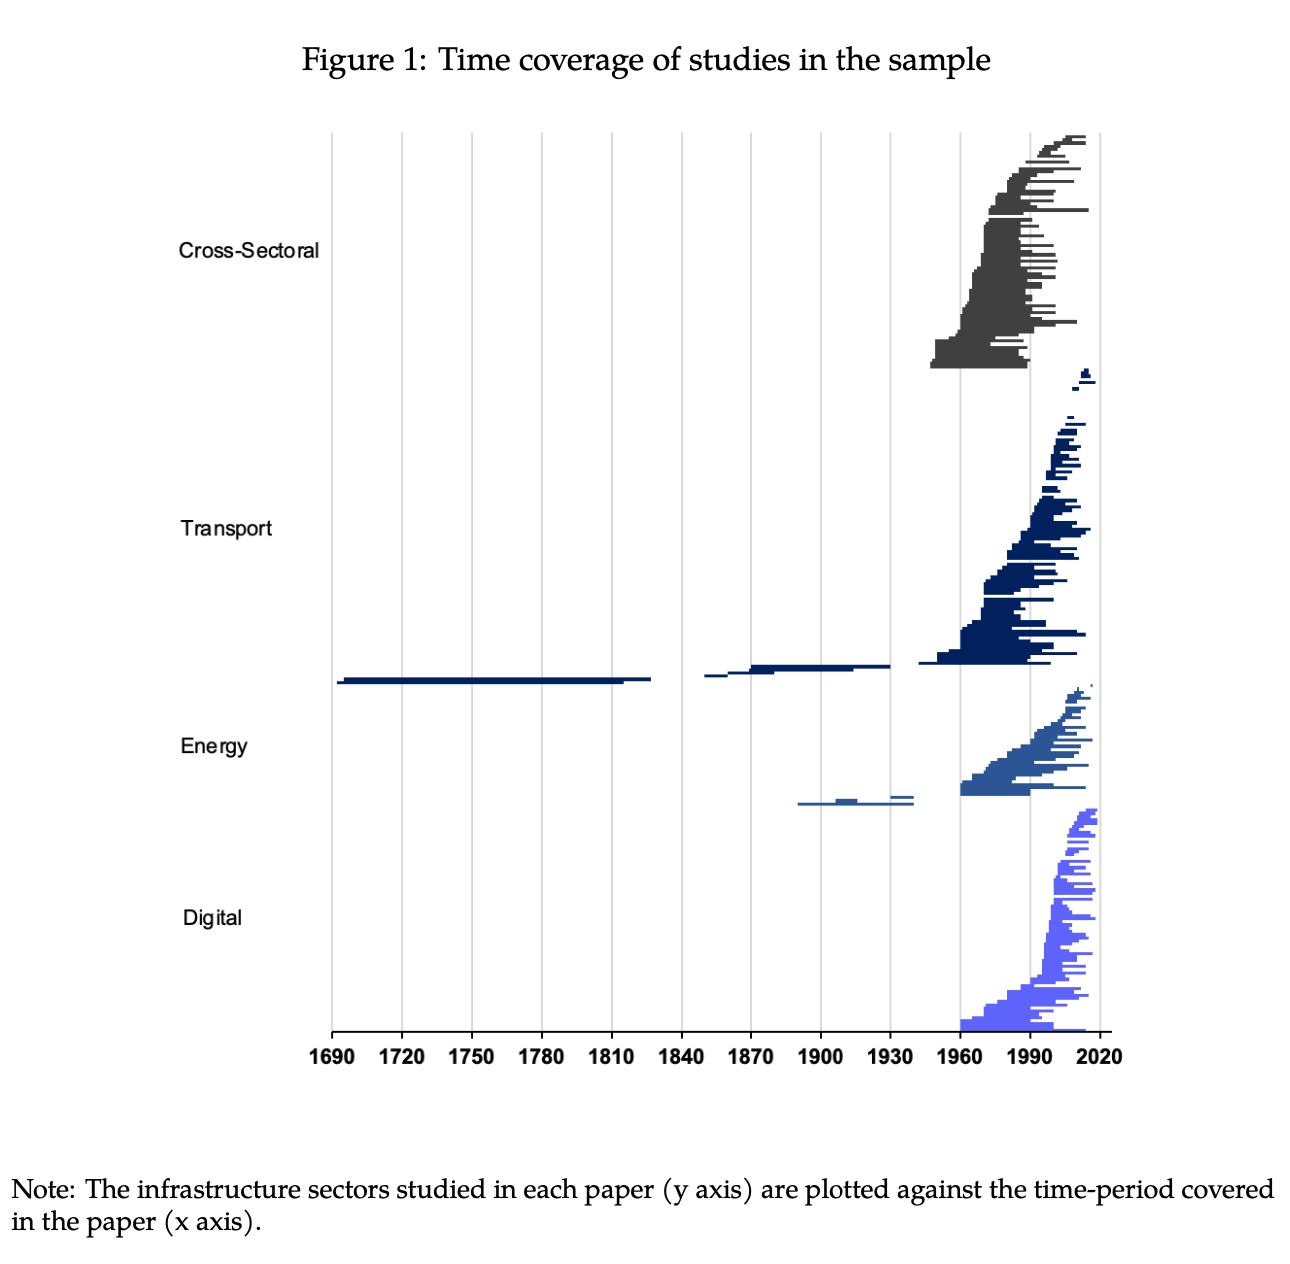
The time coverage of the studies in our sample:
- Cross-sectoral studies cover mostly the period 1960 to 1990. (* Cross-sectoral here refers to studies covering data from multiple sectors as well as public capital)
- Papers on transport and energy also cover earlier decades, sometimes even providing historical insights from previous centuries.
- The coverage of digital topics reflects two periods, with fixed telephony being the object of samples from the 1960s to the 200s, and studies on internet and mobile phones populating the subsequent period.
The distribution of estimates, by sectors and types of outcomes:
- In terms of sector, the largest category is transport with 393 estimates, followed by studies using a cross-sectoral measure of infrastructure, energy, and digital, all with slightly over 200 estimates.
- It is also noteworthy that despite a trend towards the diversification of outcomes, overall 958 out of 1074 estimates correspond to only three categories: micro and macro output, and labor market.
- Transport studies is where this inclusion of new topics is more obvious, with 90 outcomes out of 393 not belonging to the three main categories.
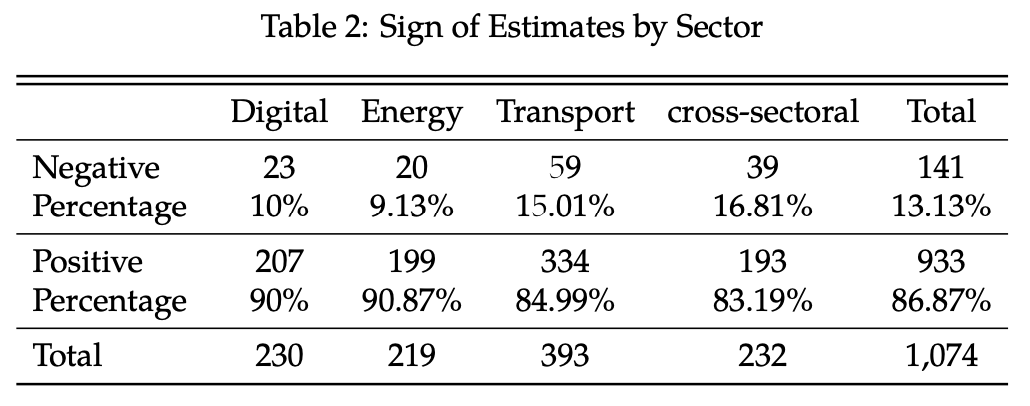
The distribution of the sign of estimates by sectors:
- Approximately half of all estimates (540 out of 1074) correspond to developing countries sample, This proportion is highest for energy (82 percent of estimates) and transport (60 percent), and much smaller for digital (38 percent) and cross-sectoral estimates (16 percent).
3. Methodology
- We aim to deriving our own summary estimates of the underlying "true" effect that can be inferred from existing studies, explain the observed heterogeneity in the existing evidence, and assess to which extent it may suffer from publication bias.
- When running estimations, we also look at specific sub-samples combining one sector and one outcome, whenever enough observations are available, because combining homogeneous depend and independent variables categories is likely to reduce sample heterogeneity.
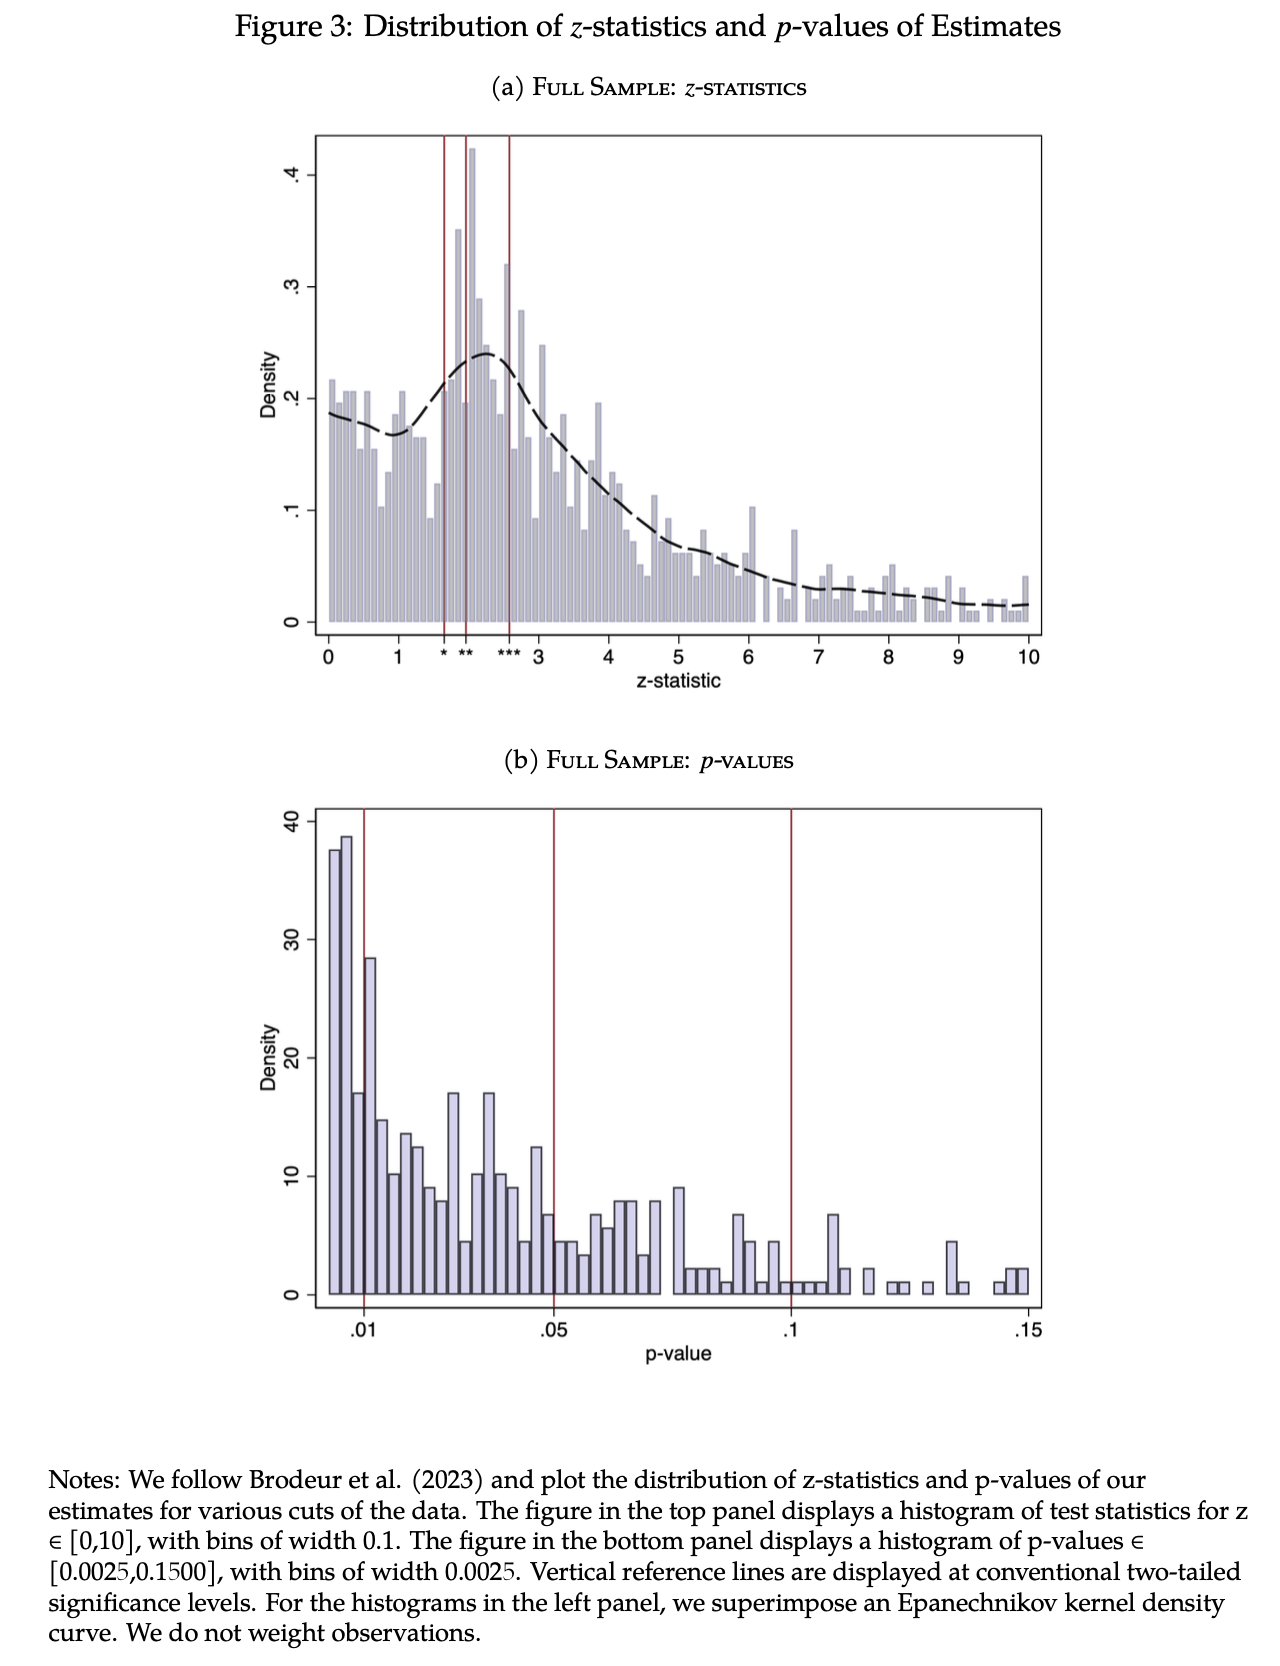
- We start by presenting distribution plots of p-values and z-statistics in order to visually inspect whether there is evidence of bunching at statistical thresholds in our sample, and provide related tests of bunching and discontinuity at significance thresholds.
- Next, we move to the FAT-PET-PEESE approach, which consists of three steps. 1) The Funnel asymmetry Test (FAT) provides an assessment of publication bias by looking at the relationship between the effect size of the studies and their precision as measured by the standard error of the estimate. Under random sampling theory, the two should be independent. Next, based on the same equation, the Precision-effect test (PET) indicates whether there is an effect beyond potential publication bias. Finally, the last step is to explicitly account for the heterogeneity across studies, by including in the estimations relevant moderator variables.
- Simply adding the whole set of moderator variables produces very noisy estimates and is likely plagued by multicollinearity issues, as some of these variables are highly correlated. To address this issues, we apply several methods to select an appropriate model with a smaller subset of control variables.
| Methods | Explanation |
| 1. LASSO | It minimizes mean squared error subject to a penalty on the absolute size of coefficient estimates. Based on the nature of the penalty the lasso sets some of the coefficient estimates exactly to zero thereby removing some predictors from the model. The degree and type of penalization are controlled by tuning parameter(s). Under the rigorous approach, the tuning parameters are theoretically grounded, guaranteeing optimal rate of convergence for prediction and parameter estimation. There is a high priority on controlling overfitting which results in parsimonious models. Alternatively, the tuning parameter can be selected using cross-validation (CV) to optimize out-of-sample prediction performance. CV methods are universally applicable but are computationally expensive. We implement these using rlasso and cvlasso commands in Stata. |
| 2. Bayesian Model Averaging (BMA) |
Bayesian Model Averaging estimates 2^k regressions (where K is the number of covariates) representing possible combinations of true data generating process (DGP). Each model is assigned a probability called posterior model probability which reflects how likely it is that a given combination of covariates represents the true DGP. Each covariate is also assigned a probability called posterior inclusion probability which indicates the likelihood of that covariate belonging to the true DGP. We implement the procedure using the bmaregress command in Stata.
|
4. Results
4.1 Main Plots and Estimations
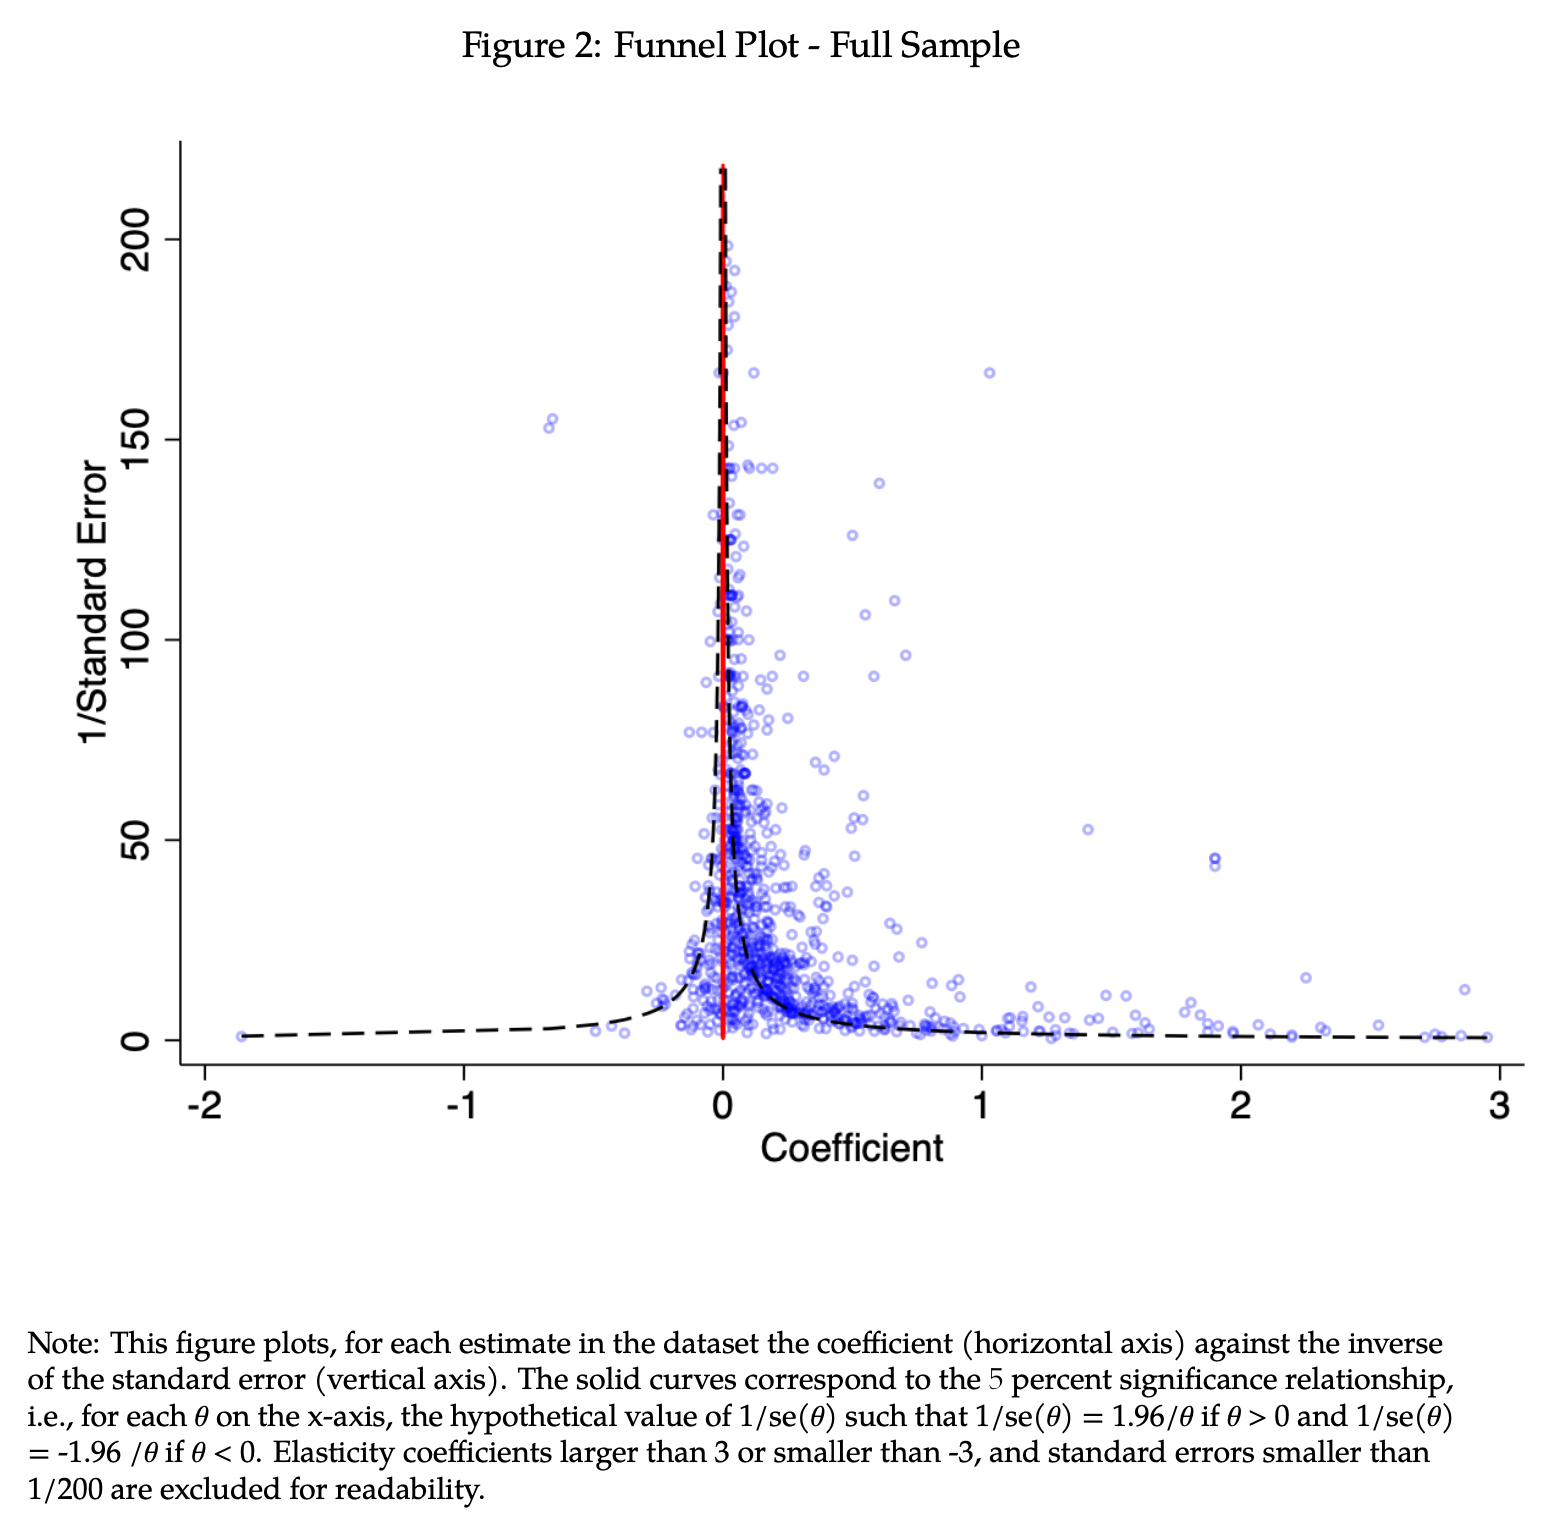
The funnel plot for the whole sample:

The distribution of p-values and z-statistics for the full sample of estimates:

4.2 Moderators
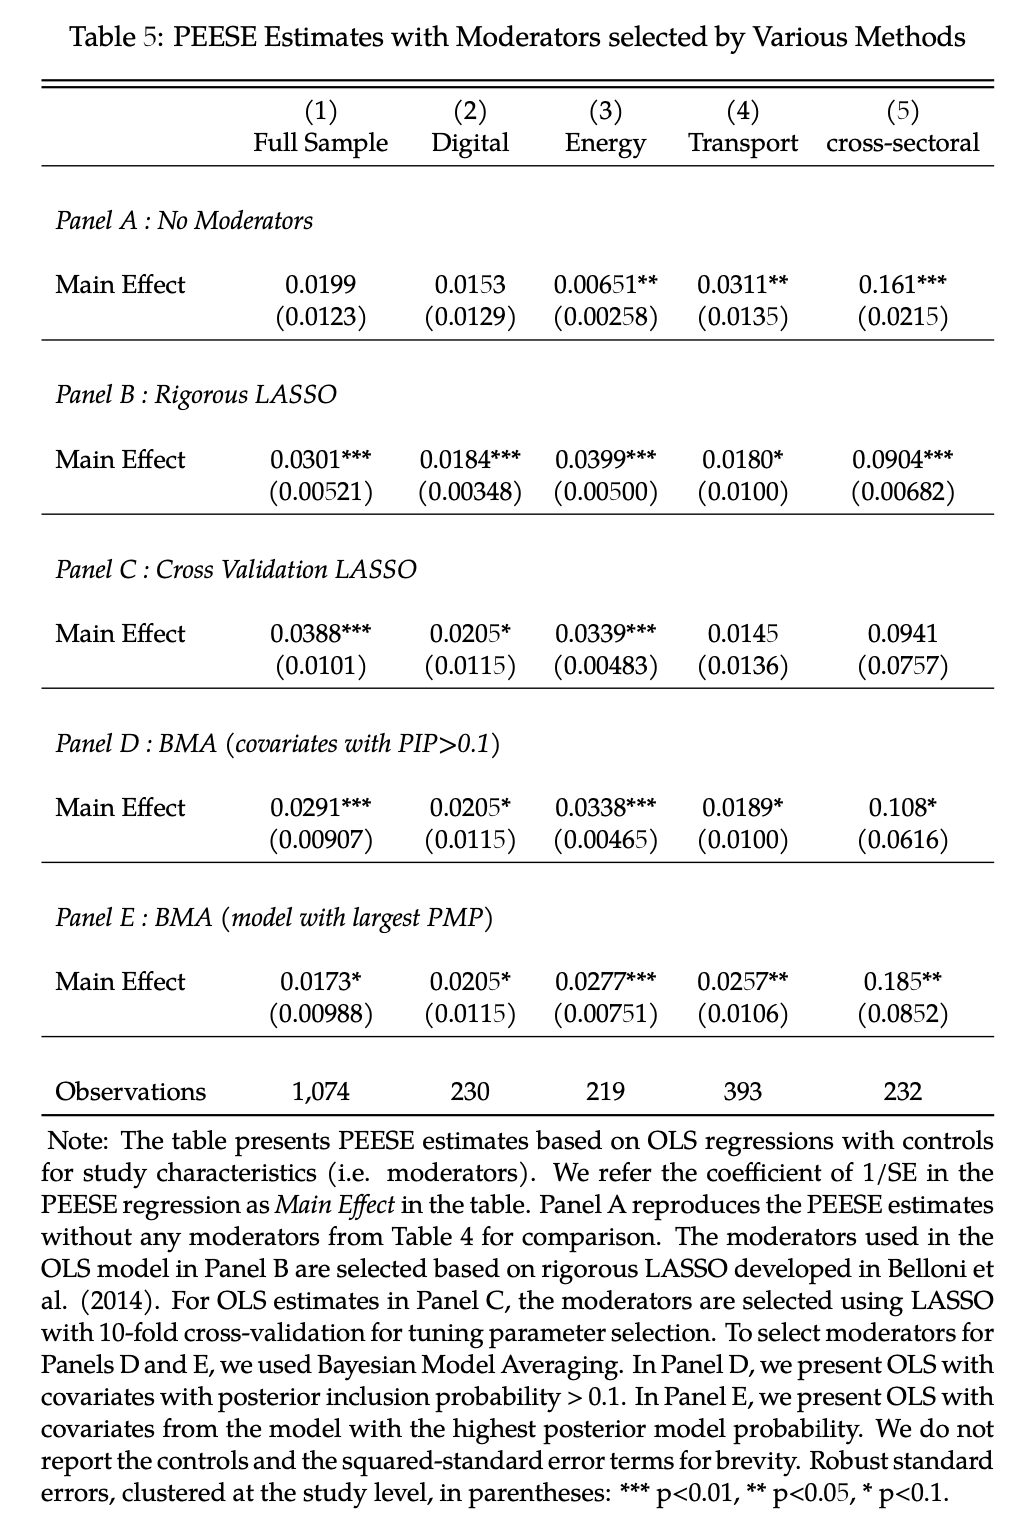
The elasticity in the full sample is positive and significant in the range 0.02-0.04,
- the digital elasticity is in the 0.018-0.21 range,
- energy between 0.028 and 0.040, and
- transport between 0.15 and 0.025.
4.3 Disaggregated Results
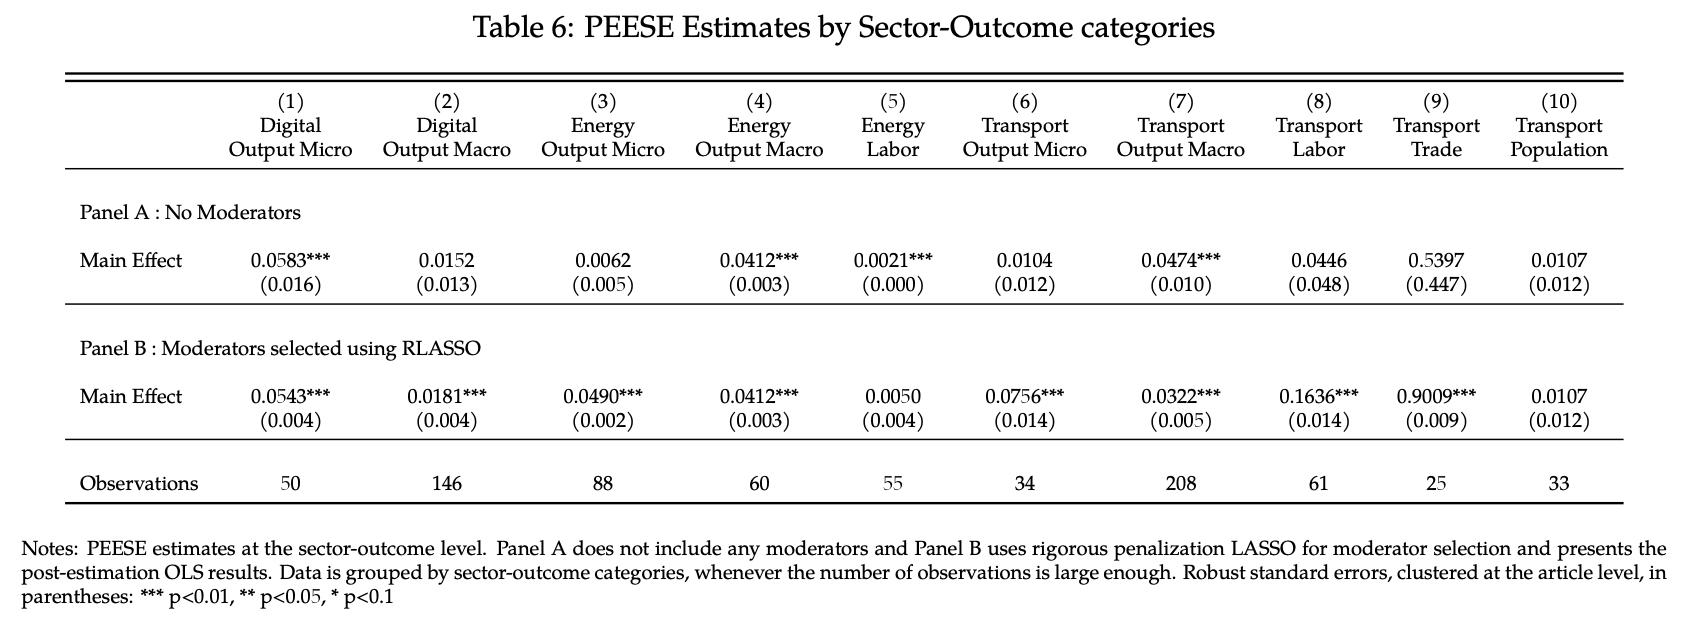
- The result displys large variation within sectors. The estimated elasticity in the digital sector are large and significant for micro-output (estimated on the basis of firm- or household-level observations), between 0.05 and 0.06, but about three times smaller for macro output.
- For energy, micro- and macro-elasticities are comparable, between 0.04 and 0.05 and significant, but indistinguishable from zero when looking at labor market outcomes.
- For transport, elasticities are systematically significant, being the largest for trade (0.9), followed by labor outcomes (0.15), and micro-output (0.08), and smaller for macro-output (0.03), and null for population.
- It thus appears that across sectors, elasticities are larger when based on studies covering micro-, and labor market data than more aggregated data.
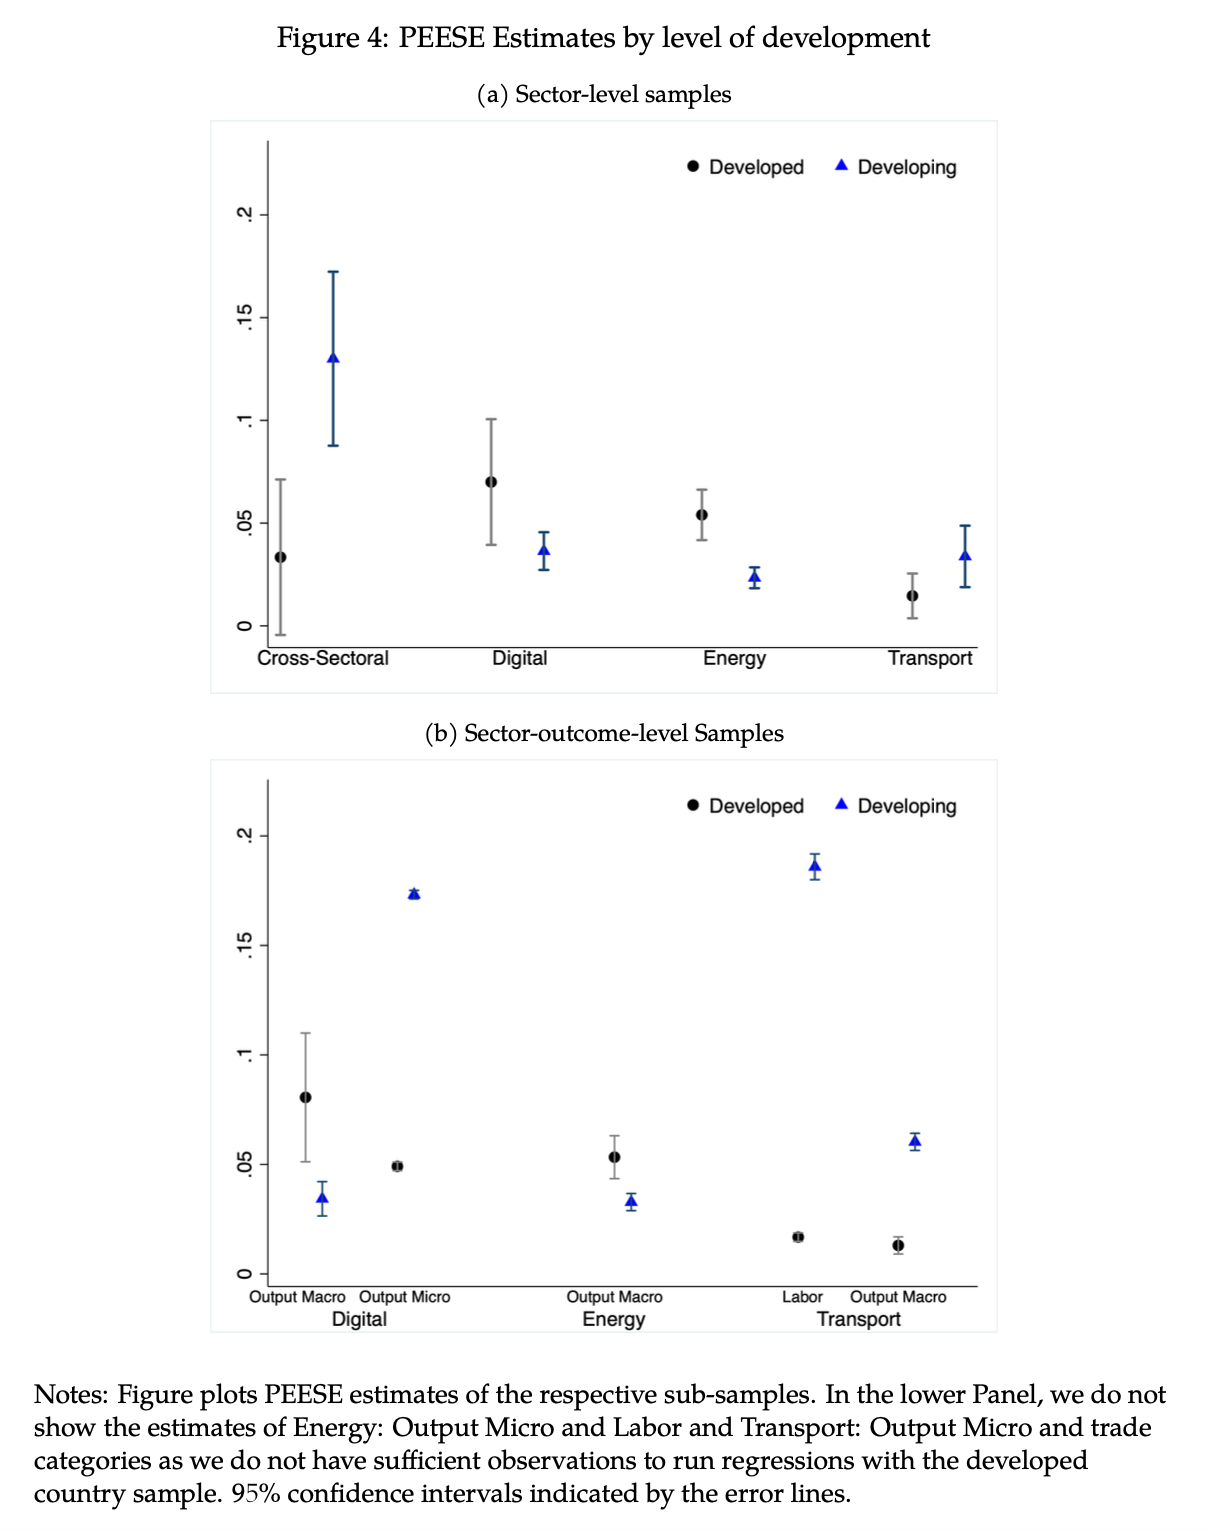
- In Figure 4, we present sector-level (panel A) and sector-outcome results (panel B) including rigorous LASSO-selected controls, splitting the sample between developed and developing countries. The results are somewhat surprising, as elasticities are higher for developed countries in 2 out of 4 sub-samples, namely digital and energy studies, and only larger for developing countries in the case of transport and cross-sectoral studies.
- This may argue for the existence of network effects, whereby high returns require a minimum level of quality coverage. They can also be related to studies showing low returns to investment in some developing countries contexts, for example in the case of rural electrification.
- On the other hand, the results for transport are consistent with some qualitative evidence for large deficits and high returns in the sector.
4.4 Robustness
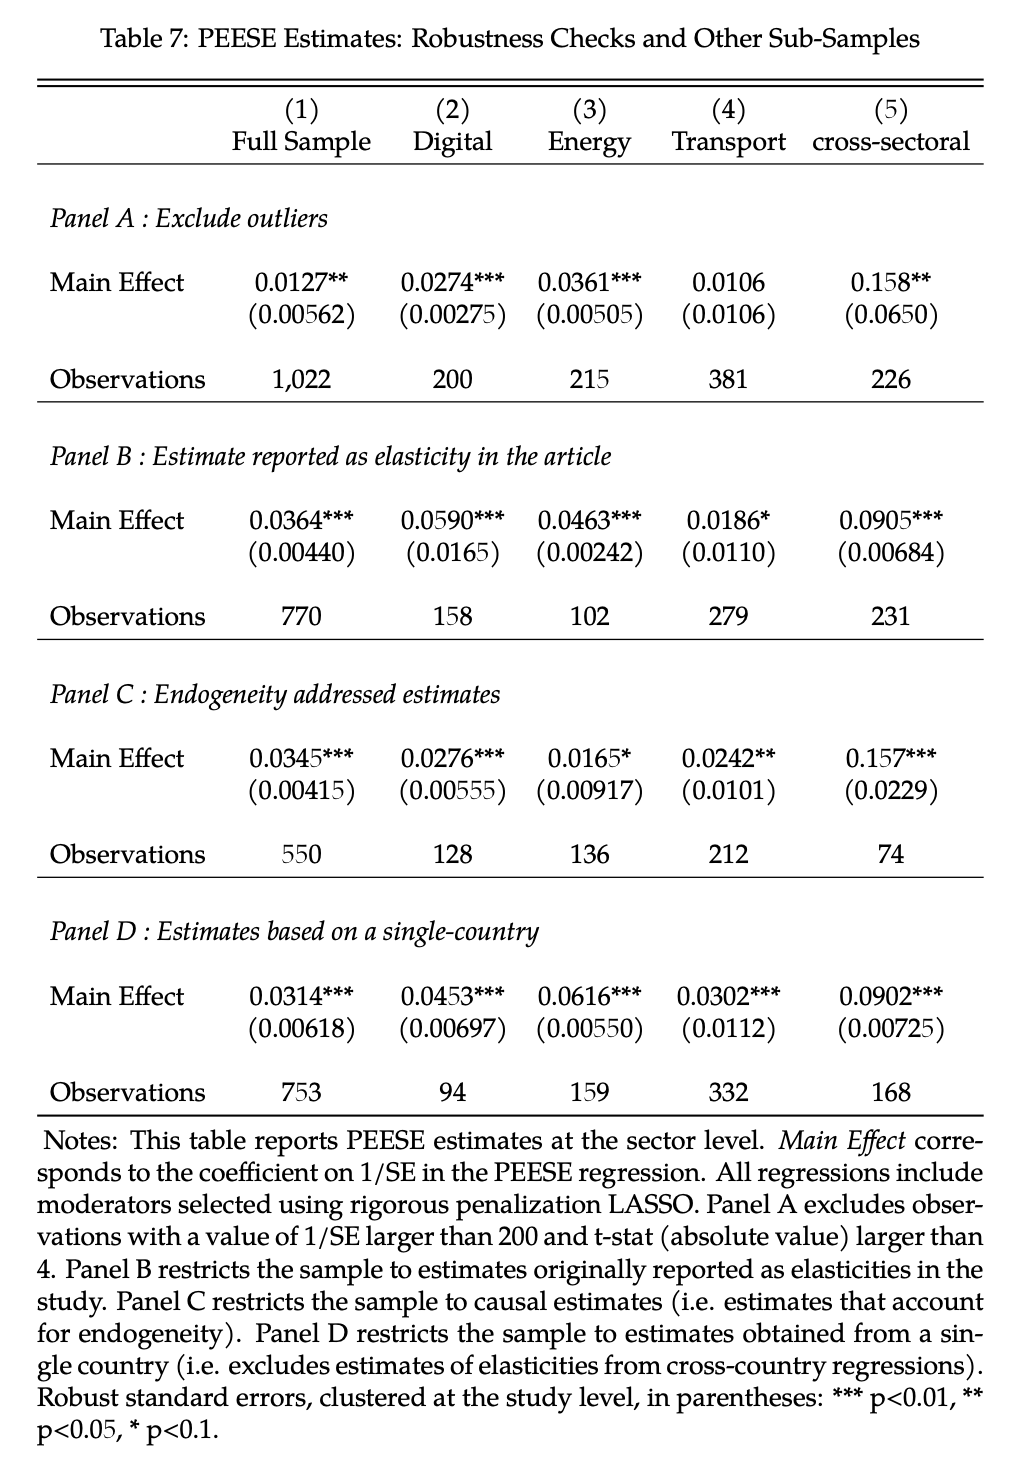
- While the different robustness exercises introduce some variation in the resulting meta-elasticities, these remain broadly consistent overall.
- In the full sample, the estimated co-efficients are very stable, only slightly smaller in panel A, while in the cross-sectoral sample, they remain comparable to previous results, between 0.09 and 0.16. Focusing on the three main sectors, the overal elasticity for digital is now slightly higher, between 0.03 and 0.06, while is perhaps not surprising given that studies focusing on this sector concentrate most of the outliers in the full sample.
- For energy, estimates are very stable, only about half smaller when including only estimates addressing endogeneity.
- Finally, estimates for transport remain in the 0.02 to 0.03 range and are significant, with the exception of panel A, where it is reduced to 0.01.
5. Discussion and conclusion
First, there is evidence of systematic publication biase in this literature. Studies reporting positive results tend to be overrepresented. Identifying this bias is important, as it allows us to isolate the residual "true" effect in different sub-samples.
Second, since the topic became of relevant policy concern in the 1980s, the literature has diversified in many directions. It has moved from an initial focus on public capital measures of infrastructure to other types of data, including physical measures and more granular micro- and spatial data.
Third, we show that studies based on public capital measures yield larger estimates. Cross-sectoral studies, which rely in more than 80 percent of cases on public capital measures, have an estimated average elasticity of 0.16, even after controlling for publication biase. On the other hand, sector studies relying almost exclusively on physical, access, or usage measures yield elasticities that range between zero and 0.06 at most.
Four, of specific interest to us is how these numbers would differ when splitting the sample of studies according to the level of development of countries. We find important heterogeneity. While effects appear larger in developed countries for digital and energy studies, cross-sectoral and transport studies based on developing countries produce larger elasticities. Notably, larger estimates are found at specific outcomes in developing countries, such as the impact of digital investments on micro-level output, at 0.16, or of transport investments on labor market outcomes, at 0.18.
Finally, there is an important issue regarding how to interpret these elasticities for policy recommendations. Deciding on which policies or sectors to prioritize, and possibly on potential financing strategies, would require that we translate elasticities into specific rates of returns. This is in turn implies the need for infrastructure capital stock figures.
'▪ Research' 카테고리의 다른 글
| Approaches to WASH Infrastructure Cost Analysis (0) | 2025.02.18 |
|---|---|
| 2G·3G·4G·5G Network Architecture Diagrams (0) | 2025.02.12 |
| 아프리카 금융포용 필요성 및 전략방안 제시 (0) | 2024.08.24 |
| Guide: Converting KOICA OpenAPI Data to Files Using Python (2) (0) | 2024.08.08 |
| Guide: Converting KOICA OpenAPI Data to Files Using Python (1) (0) | 2024.08.07 |


